Results and findings.
Selected work with methods, metrics, and the actual outcomes, including the ones that did not go as planned. I treat negative and unexpected results as findings worth reporting, not noise to hide.
Distributional Forecasting with GANs
I asked whether borrowing TimeGAN's autoencoder structure and adding attention could improve a financial GAN's distributional forecasts of ETF excess log returns. The answer turned out to be no, and working out why was the part that mattered.
- Architecture. Extended FinGAN with TimeGAN's embedder and recovery network, plus attention over the latent context vector.
- Training. Two phases: autoencoder pre-training with Gradient Norm Matching, then adversarial fine-tuning under combined Sharpe and PnL losses.
- Data. Sharadar prices through ArcticDB, covering 28 equities across 9 sectors.
- Benchmarks. FinGAN, LSTM-Fin, ARIMA, and Ridge AR(10), evaluated on Sharpe, PnL, directional accuracy, and distributional metrics.
- Validation. A layer of statistical tests on the generated return distributions, challenging the model's distributional accuracy directly rather than assuming it. The full battery is detailed in the Evaluation, Baseline, and Diagnostics section of the thesis.
The TimeGAN extension degraded out of sample performance against the FinGAN baseline rather than improving it. The added structure did not help on this data.
The reference FinGAN codebase held an implementation error that understated its reported Sharpe ratios. Correcting it produced a stronger and more honest baseline than the published one.
| Model | Sharpe |
|---|---|
| FinGAN (corrected baseline) | +3.17 |
| This work (TimeGAN extension) | +1.083 |
| LSTM-Fin | +1.370 |
| ARIMA | +0.642 |
| Ridge AR(10) | +0.227 |
Reported on held out data across 28 equities in 9 sectors.
PCA as a Covariance Filter, Not a Labeler
I applied PCA and clustering to daily S&P 500 returns from 2000 to 2026 to ask two things: does unsupervised clustering recover the GICS sector taxonomy, and does the resulting risk model beat standard baselines on a risk adjusted basis. The headline result was one the project prospectus did not predict. PCA wins, but as a covariance filter feeding a minimum variance optimizer, not as a cluster labeler.
- Universe. Survivorship bias free, point in time S&P 500, roughly 1,099 historical members across 290 monthly rebalances, with prices from Sharadar stored in ArcticDB.
- Residual panels. Three input panels, raw returns, a CAPM market residual, and a sector beta residual, to separate market, sector, and idiosyncratic structure.
- Walk forward PCA. Refit each month on a trailing 252 day window, with the Marchenko-Pastur edge setting how many principal components count as real factors rather than noise.
- Clustering and portfolios. Compared k-means, Ward, average, and single linkage against GICS, then built and benchmarked nine portfolios, from naive cluster picks to minimum variance on a filtered covariance matrix.
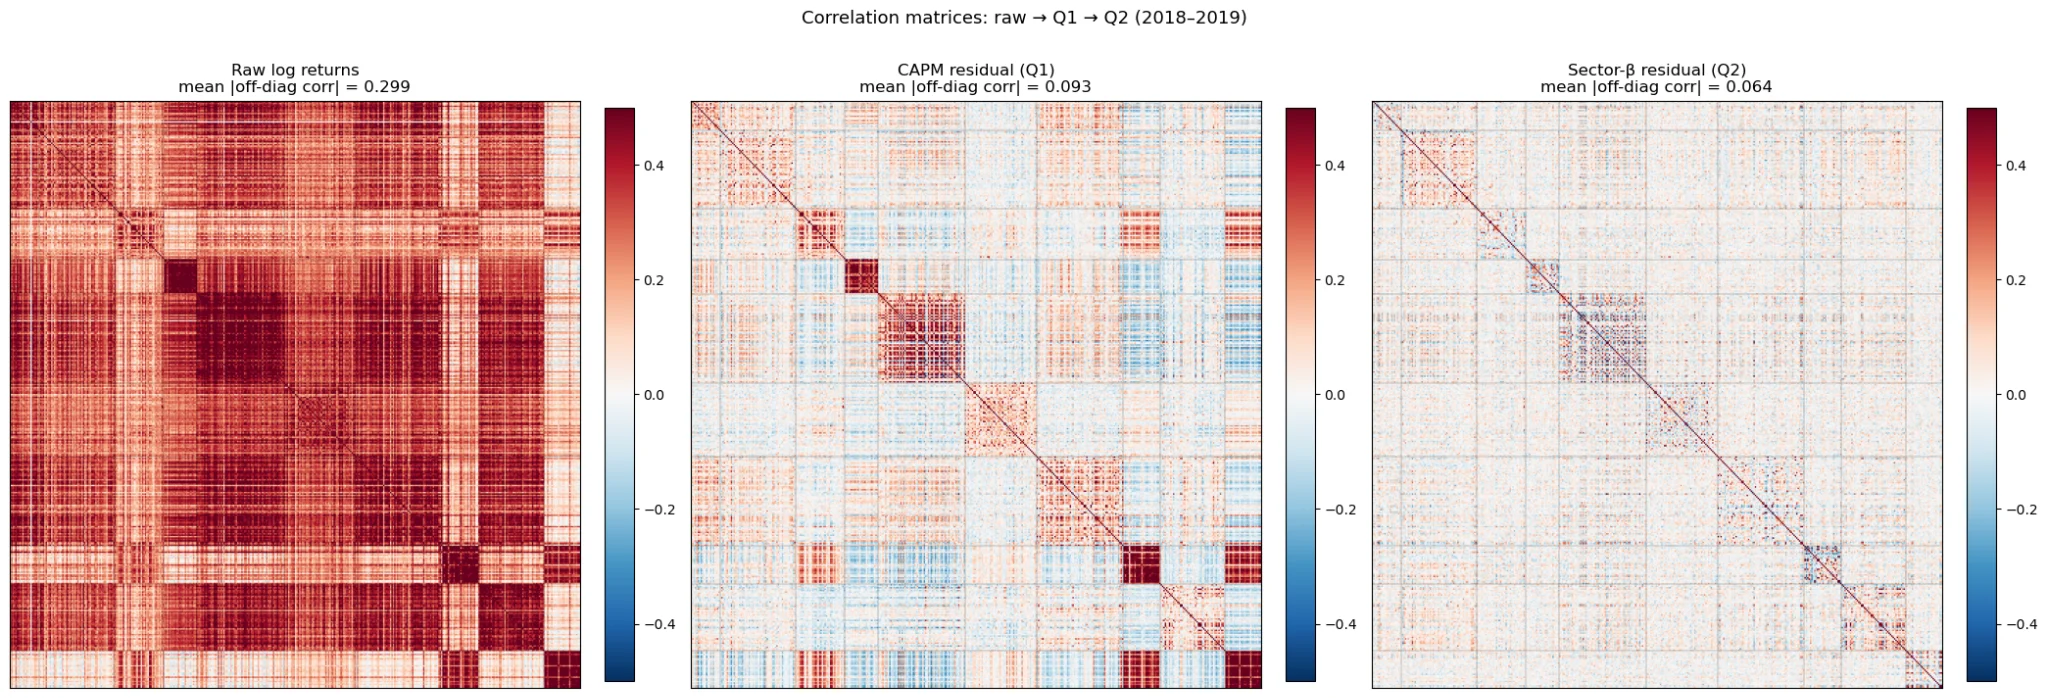
Clustering on market residualized returns partially recovered GICS sectors at an Adjusted Rand Index of 0.244, real but limited agreement reached with no information about company business lines. Stripping the sector signal too dropped agreement roughly fivefold, confirming the residualization did what it was designed to do.
The naive one stock per cluster portfolios underperformed every baseline, including plain equal weight. The winner was minimum variance on a Marchenko-Pastur filtered covariance matrix, at Sharpe 0.94 against 0.51 for equal weight, with the lowest drawdown of the set. PCA's real value here is as a covariance filter.
| Portfolio | CAGR | Vol | Sharpe | Max DD |
|---|---|---|---|---|
| Best cluster portfolio | +11.0% | 27.1% | 0.41 | -121% |
| Equal weight S&P 500 | +10.5% | 20.8% | 0.51 | -87% |
| GICS stratified | +10.8% | 20.6% | 0.53 | -84% |
| HRP (Lopez de Prado) | +10.3% | 16.7% | 0.61 | -66% |
| MV, cluster filtered (Tola) | +8.2% | 12.8% | 0.64 | -46% |
| MV, RMT filtered (this work) | +10.4% | 11.1% | 0.94 | -32% |
Selected portfolios from the nine tested, monthly rebalance, 2002 to 2026.
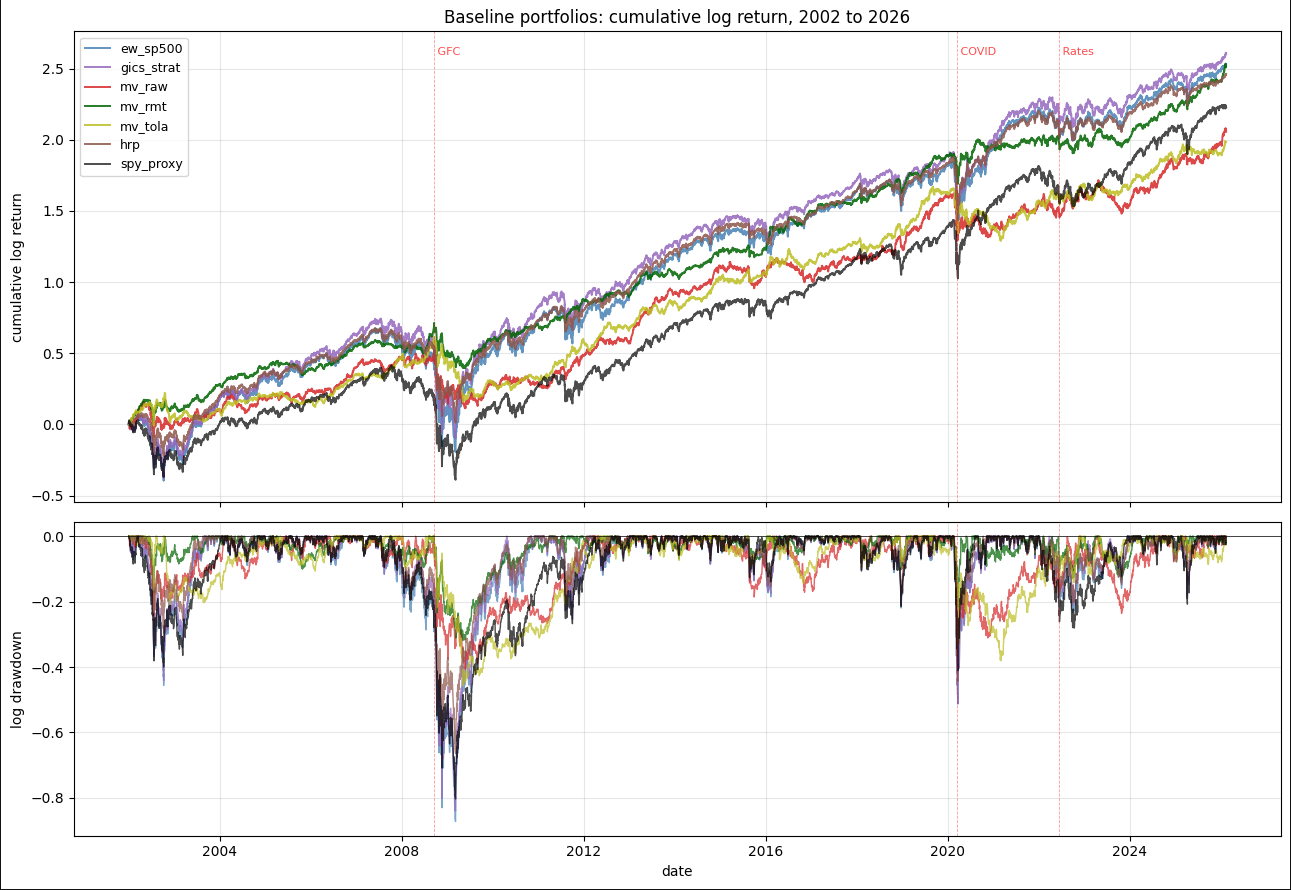
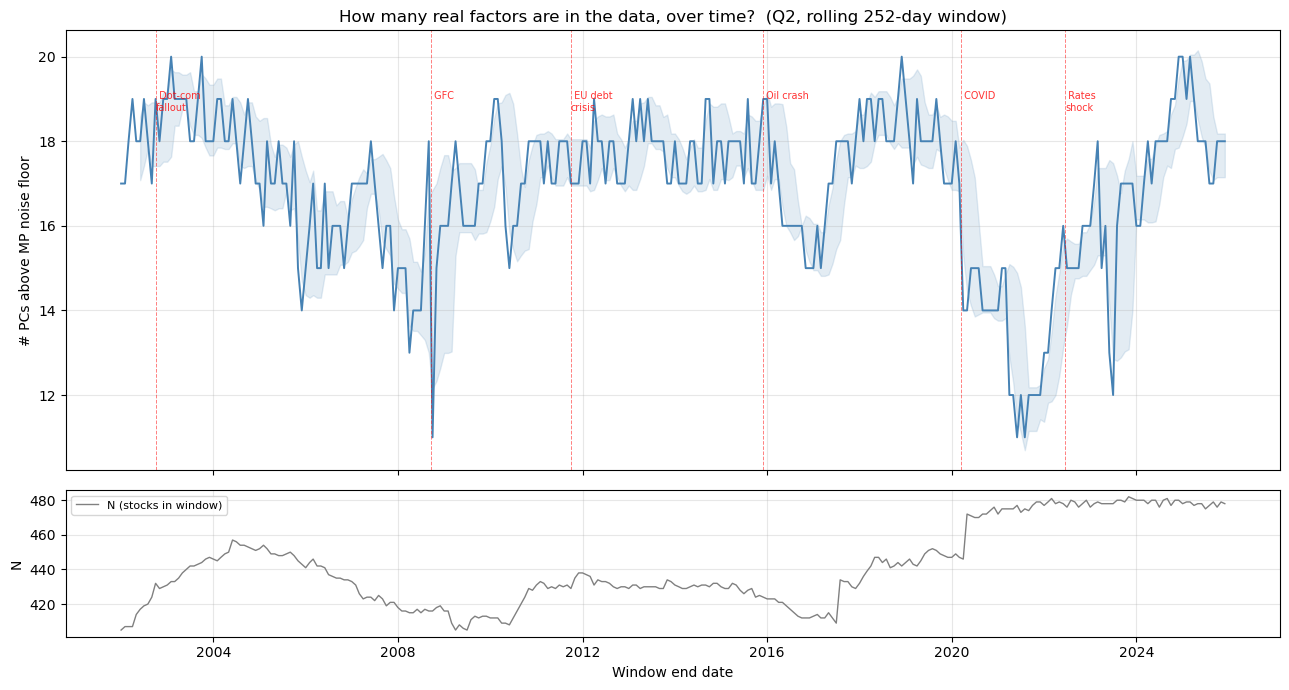
A crisis period check supports the same conclusion: the RMT filtered portfolio's predicted risk contributions tracked its realized losses more reliably than any baseline across both the 2020 and 2022 drawdowns. The number of real factors itself compresses during crises, falling from roughly 18 to as few as 11, which the walk forward pipeline captures directly.
Algebraic Computation and Knot Theory
Co-developed a Prolog program to determine the decidability of the unification problem on right quasi terms, letting users input algebraic expressions and compute valid substitutions. Also contributed to classifying knots from the Tait-Rolfsen table by formulating algebraic colorings and exploring tractability.